NZ Renewables UKNZ Renewables UKOnshore Wind Based Renewable Energy
How we design projects

Onshore Wind Powered Hybrid Systems Development

In-house tools for layout, noise and hybrid plant, long-term wind resource, consultation evidence, and risk assessment including Monte Carlo.

Science Based Engineering and Assessment

The NZ UK team comprises a team of experts with experience in all aspects of energy and infrastructure including:
  • Paul, our technical director, has a degree in engineering and coordinates our work analysing millions of data points of wind data and translating this into robust designs.
  • Nigel, who leads our EIA work, has a PhD in geomorphology and brings 40 years experience developing and implementing methods to assess complex problems and translate them into informed and defensible decisions.
  • Dan has a PhD in chemistry and works with governments and businesses addressing some of the more complex challenges of developing a business case for sustainable aviation fuels (SAF) and carbon capture and storage (CCS), battery storage (BESS) and long duration energy storage (LDES).
  • Hamish, with a degree in agricultural engineering, leads on hydrogen, GHG accounting and biochar, and is the custodian of the NZ hybrid models.
  • Nick has a degree in physics and uses GIS and his Python and R skills to develop and manage our noise, flicker and wake models.
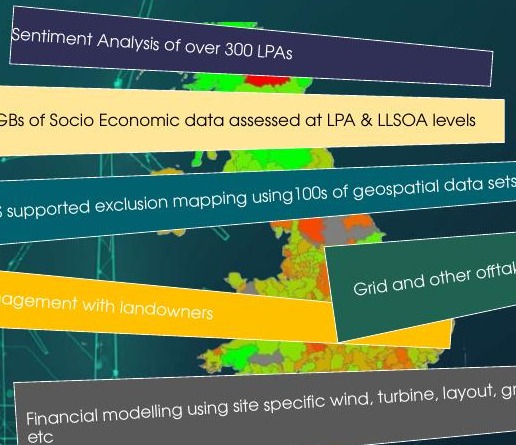
Site screening: sentiment, socio-economics, GIS, landowners, grid and financial modelling
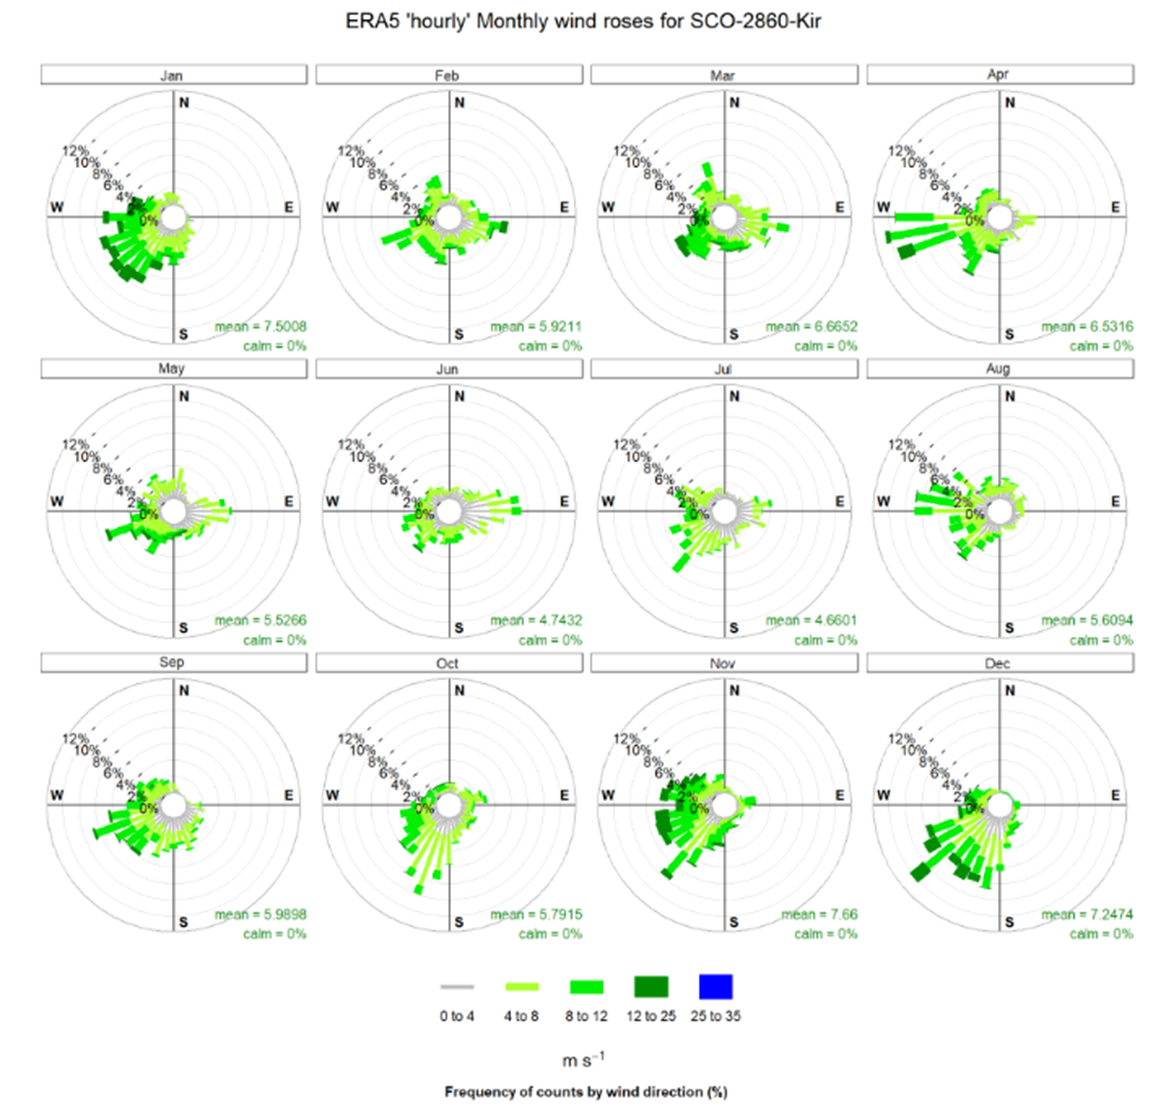
ERA5 hourly monthly wind roses

Wind resource and energy yield

Resource assessment uses ERA5 hourly data, typically 20 to 30 years, at the site. Monthly wind roses show where the energy sits through the year, not a single annual average.

  • Direction and speed by month, at hub height and at 10 m.
  • Layout and wake losses read from that rose, not from a generic UK wind climate.
  • Energy yield then carries diurnal, seasonal and annual variation into the probability of exceedance used in the financial case.

Consultation

We analyse data from our, and others projects to better understand how people value landscape over income, education and other MPI indicators.
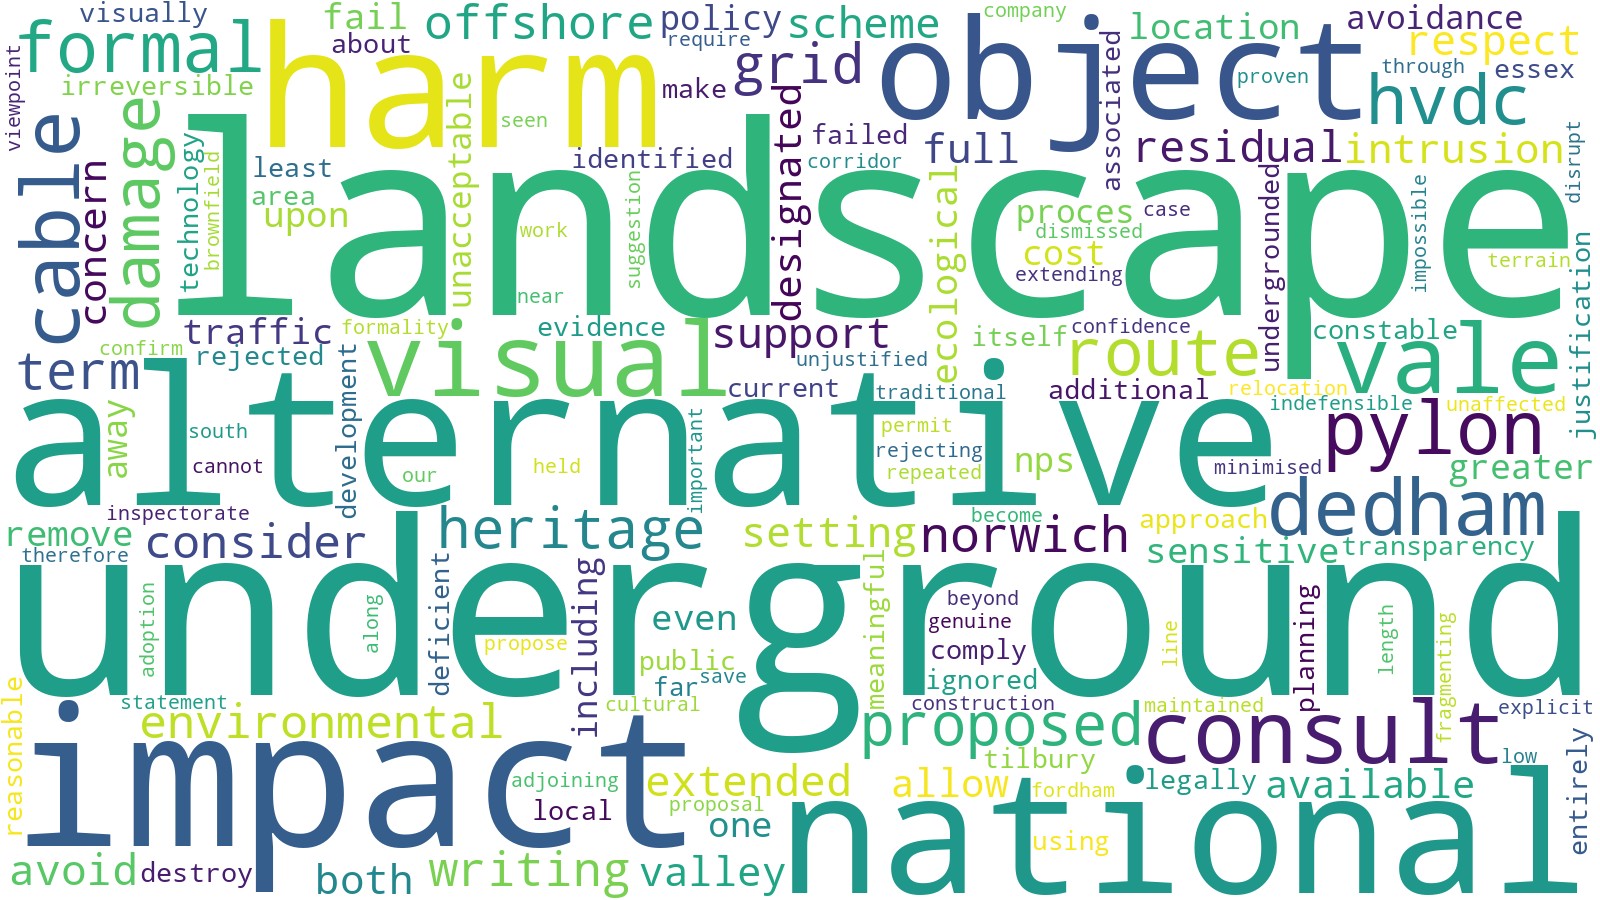
  • We assess LPA sentiment and political indicators to understand the broader context.
  • This deep understanding of the socio economic context enables us to price in appropriate mitigations very early in the design.
  • This information and knowledge coupled with local presence helps us frame our engagement strategies.
Consultation word map
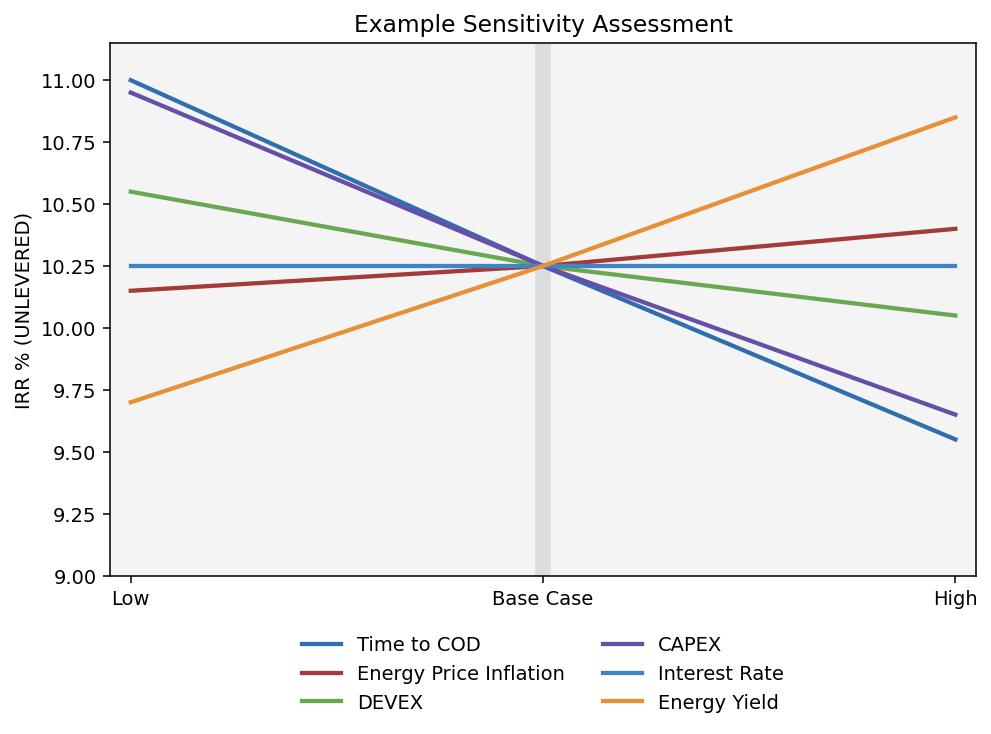
Risk sensitivity spider

Risk assessment

We have various ways to assess the different types of risk.

  • Many factors such as time to commercial operation, energy price, DEVEX, CAPEX, interest rate and energy yield are assessed as part of our financial modelling and can be presented in spider diagrams as shown here.
  • Other risks are retained in our risk registers, assessed in risk workshops where we use more qualitative methods
  • We have adotpted various methods tried and tested in other industries such as ENVID, QRA and ERA.

Negative Emissions are a real posibility

GHGs are considered in all aspects of our work and when engaging with energy users and suppliers alike. This chart shows outcomes of our modelling the significant reduction in GHG by transitioning to Biofuels and wind power and subsequently with CO2 capture and storage as BioChar.
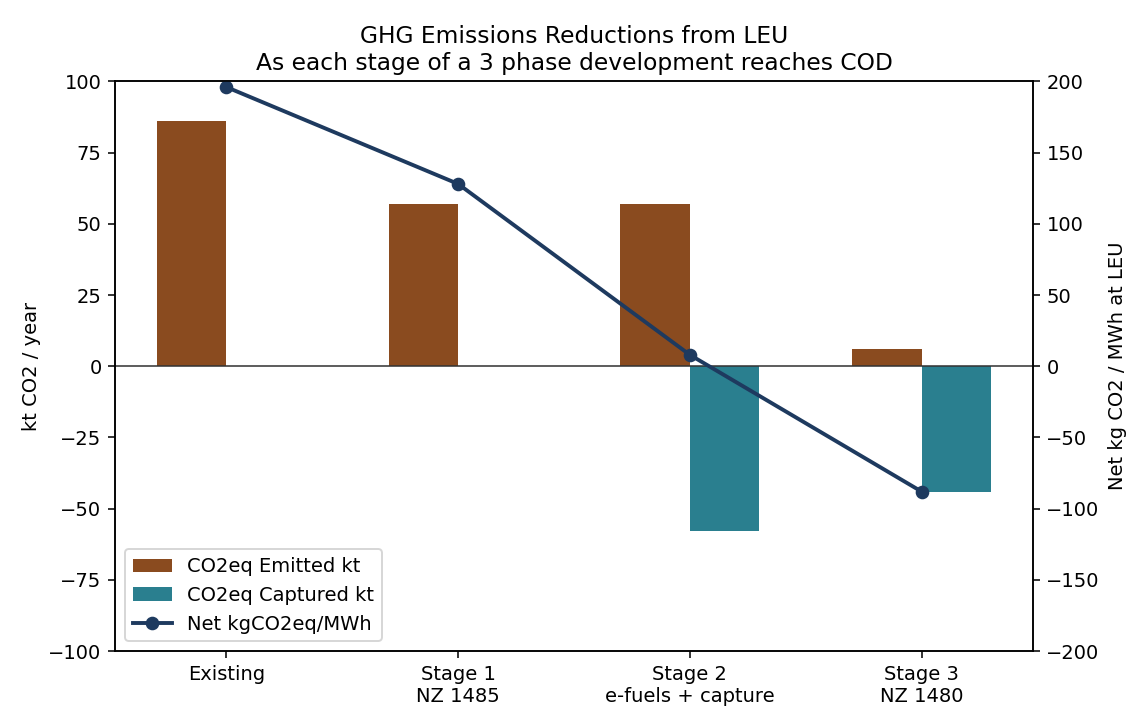
  • Emitted and captured tonnes, and the net kilograms of CO2 per megawatt-hour at the user.
  • Stage 3 is where captured carbon exceeds what the site still emits.
GHG emissions reductions at a large energy user across three stages
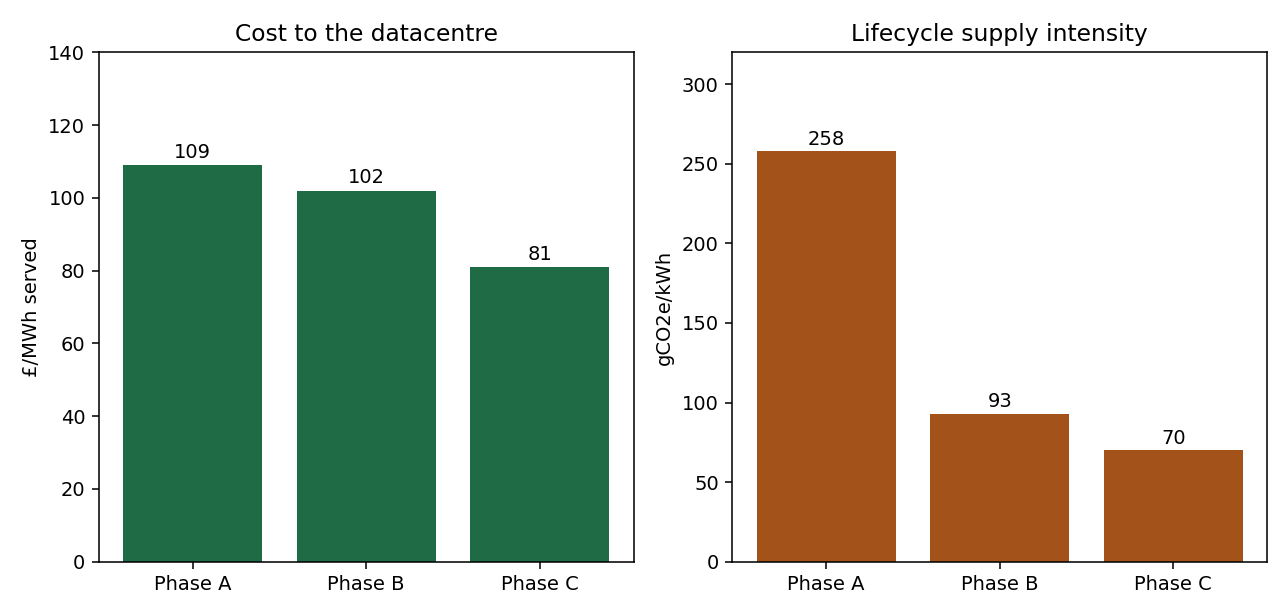
Cost to the datacentre and lifecycle supply intensity by phase

Lowering Costs and GHG

As these diagrams depict sourcing energy from renewables not only lowers the cost but also lowers emissions.

Talk to the technical team